The noon Project

Enlightened by Data

What is the Noon Project?

At The Noon Project, we aim to look at the world through a different lense for the good of society.

By using data analytics, we want to provide a different perspective on what is happening around us, from schools to work to our social lives, there is data all around us.

We try to discover what secrets this data holds, and see how we can improve our lives and the world around us.

Data

You have more data than you think, but sometimes, your data needs to be carefully collected, cleaned and connected

Insights

Once connected, data can provide a lot of insights through visualisations and simple techniques

Knowledge

By using the insights from data and advanced statistical methods, deeper knowledge can be gained

Noon

When the knowledge and insights from data is combined with domain expertise, one can truely acquire wisdom

Our Projects

We select our projects with the aim of helping our society and providing insights to the public.

Our projects are based on publicly available data, or information gained through public surveys run by us.

payment card in pos machine

CBB Statistical Bulletin Dashboard

The Central Bank of Bahrain (CBB) is responsible for numerous aspects of Bahrain's economy, including regulation of the banking system, oversight of the payment systems and governance of the monetary health of the economy.

The CBB generously provides a wealth of data in its monthly Statistical Bulletins. In order to be able to discern insights, we have extracted and compiled the data, and created a dashboard to facilitate analysis.

Go to Dashboard
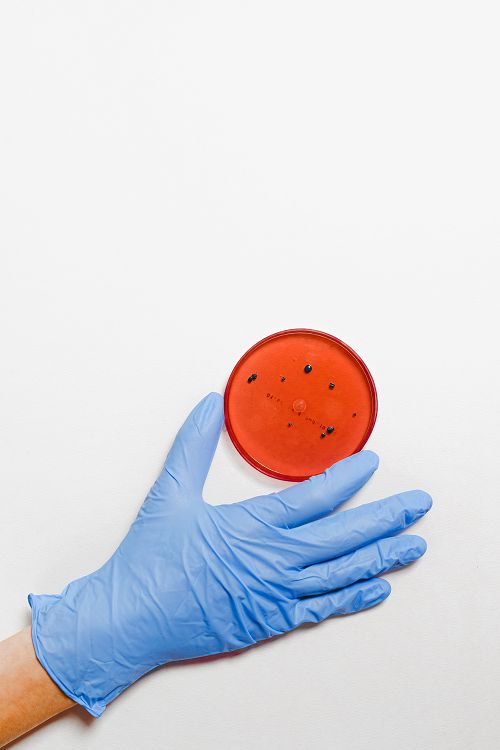
hand holding petri dish

Covid-19: Bahrain Dashboard

The novel coronavirus, SARS-CoV-2, resulting in the Covid-19 disease, has swept the globe. From restrictions on social interactions, working from home, to economic hardship this pandemic has affected nearly every person on the planet.

Many governments are reporting numbers associated with Covid-19, including the Kingdom of Bahrain's Ministry of Health, who also provide additional details on cases in their Contact Tracing efforts. We created a dashboard in order to help visualise trends and details from all this information. Including a time series of daily updates, and a cross-sectional analysis of the contact tracing information.

Go to Dashboard

Articles

We know that deeper understanding is the key to success, and we know how hard it can be to really understand something. So we hope to help everyone make more sense of the world and data around them.

Check in regularly to see updated articles explaining simple concepts and how to apply them in everyday life.

Coming soon

Insightful articles for everyday data

Get in Touch

Leave us a message and we'll get back to you!